|
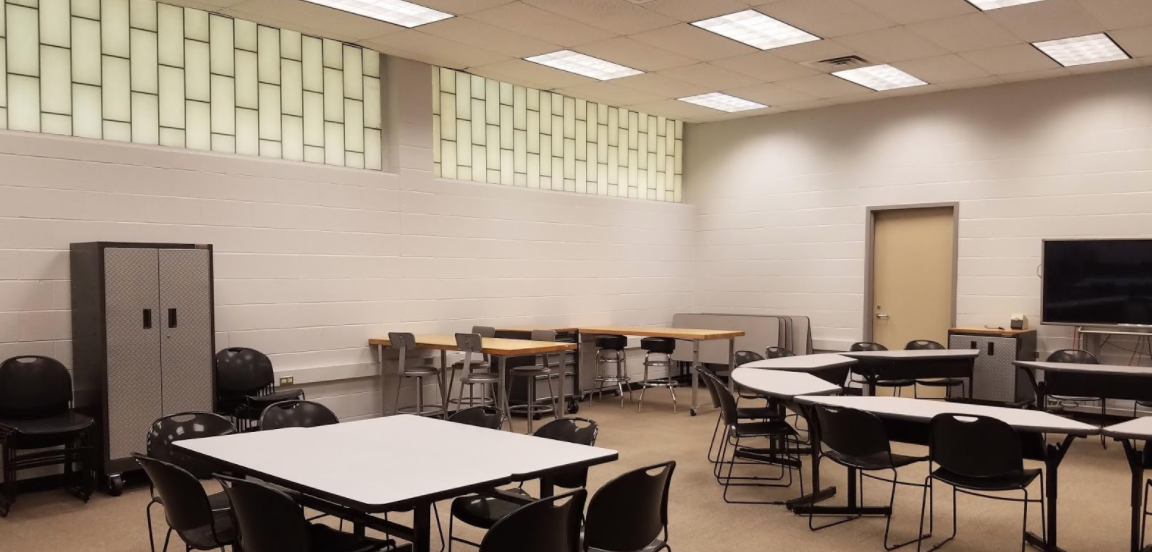
Cougar Collaboration Center at Carlynton Jr./Sr. High School. Photo by: Wendy Steiner Start with Shared Values One of the many ah-ha moments I had during the FLUENCY Project occurred while participating in an activity lead by Lauren Zito which asked us to deep dive into the choices we made when setting up our classrooms. This activity was so valuable as a source of self-reflection that I was given permission by my principal, Michael Loughren, to lead a professional development session and use Lauren’s process as a guide. I reached out to Lauren to let her know that I would be modeling her activity, and also to ask for some guidance on how I might approach this with my colleagues. Lauren’s suggestion was that we first generate a list of shared values which would help guide our discussion and our focus when we began looking at design choices. The FLUENCY cohort had a list of eight values that served as our compass while we navigated understanding and practicing FLUENCY. These shared values were: Safety, Relationships, Numbers & Narratives, Power, Inquiry Based, Transparency, Choice, and Equity. I would turn to these values to guide me as I focused on the work I was doing with my students, and I knew the benefits of having the teachers generate their own values list. I started the professional development by asking the teachers to work in small groups of 3-5 people and generate a list of three “shared values” for our building. Afterwards, we created a master list of all the values that were listed. Examples included: learning experiences, choice/ownership, safety (with technology & in the physical space), positivity, clear expectations, and extra-curricular options. Any values that were listed multiple times had a number next to them to indicate how many times the value was mentioned. Using the master list, we identified the three most repeated values as: Choice/Ownership, Positivity and Purposeful Technology. Consider the Current Spaces in the Building
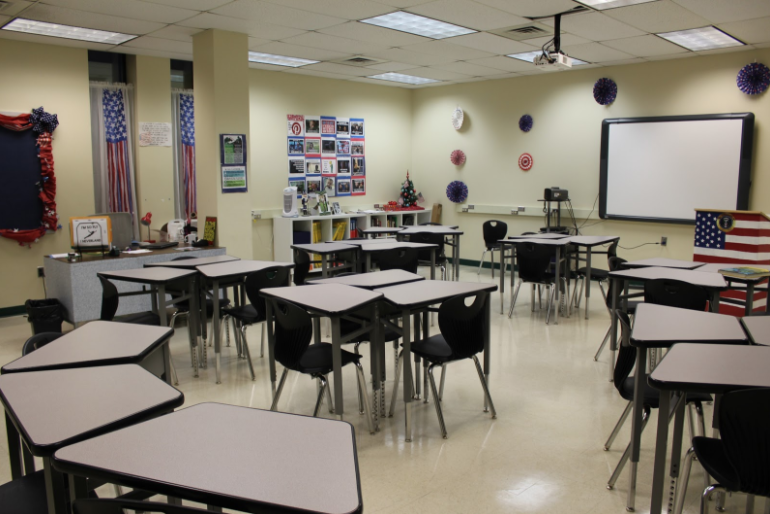
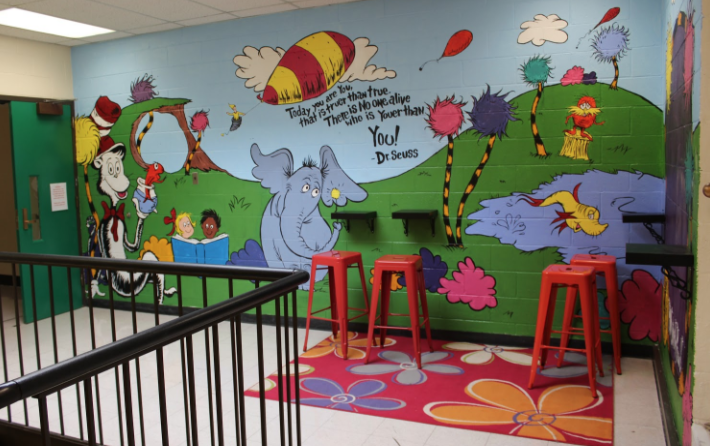
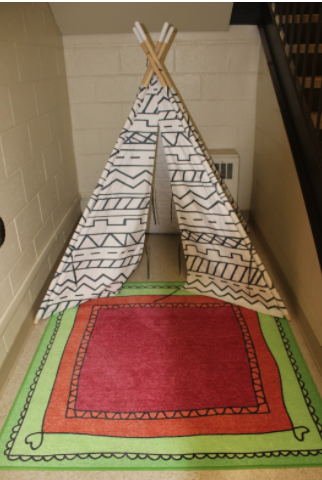
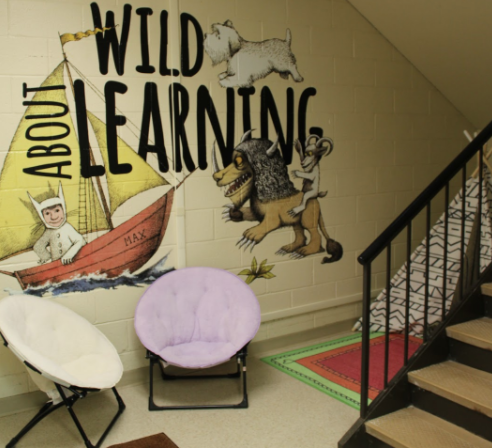
I asked teachers to think outside the box and identify any other spaces where students are encouraged to be creative and was pleased to see the inclusion of the weight room, the chem lab, the senior mural and the nature trail. The gym was identified as an area of collaboration in addition to our newly renovated Cougar Collaboration Center. It was interesting to see that no one included their own classroom on their list. Next, the teachers were asked to identify areas in and around the building that have untapped potential for student engagement. They were then asked to list ways that these areas might be transformed into space that elevates student voice and increases student engagement. Overwhelmingly the teachers selected the walls and stairwells as areas of untapped potential. In a time when money and space are at a premium, these are easy areas to convert into a meaningful space for kids. One of our elementary principals, Marsha Burleson, took these underdeveloped spaces in her building and created comfy reading nooks, colorful collaboration spaces and quiet corners for students to gather and work with their peers. Her vision allowed the educational spaces to extend beyond the classroom walls and provided opportunities for students to collaborate and be creative in a non-traditional setting. Self Reflection Faculty members were then asked to spread out and find some space where they could write and reflect individually. Our shared goals were listed on a large Post-It Note and teachers were asked to keep those goals present in their minds as they were writing. First, teachers were asked to imagine the “perfect day in their classroom” and to write a response describing what was happening in the room during that perfect day. They were to give examples of what the students were doing and also to describe what they were doing. Then, they were asked to answer the following questions:
Wrap it Up The session ended with teachers creating a wishlist of items that would help them achieve the classroom goals they set for themselves. This could include everything from choosing a paint color to alternative seating ideas. After teachers created their wish lists, they were introduced to the grant writing boot camp. Teachers were lead through the process of filling out the grant form for our Education Foundation and were also given time to set up a Donors Choose account. A teacher who has had over 12 projects funded on Donors Choose spoke about the process and gave a few tips to teachers about submitting a grant proposal. A representative of the Education Foundation spoke about the types of grants they fund and which information teachers should include on their application. Teachers completed a pre and post survey on the activities. These surveys will help guide future professional development planning. http://www.cmucreatelab.org/ http://www.fluencyproject.org/ http://www.carlynton.k12.pa.us/cms/One.aspx
0 Comments
This is the latest in a series of blogs from the teacher cohort.
- By Lee Cristofano Over coffee one Saturday morning, I was struck by an interesting article of data journalism from the newspaper: What is the most common name for a licensed Allegheny County dog in 2016? (Before reading further, I invite you to guess…) I was intrigued by this innocuous question. After all, did the newspaper task some reporter (or, more likely, intern) to survey pet stores looking for dog food customers to ask for their dog’s name? How does one get insight regarding this question? Fortunately, we are living in times where data such as this is becoming readily available to the public, the so-called Open Data revolution. Government agencies, in their efforts to become more open and transparent, are making datasets available freely for the average citizen (and data nerds like us!) And it’s now possible for nearly anyone to answer the question above. (Did you guess “Bella”?) And so, we asked our high school class that very same question: What do you think the #1 dog name in Allegheny County was last year? We had many good suggestions – Buddy was a class favorite – but as the teacher, we were less interested in their answer and more interested in how the class might answer the question. Thus began our journey into the process. Finding the dataset; downloading it so it might be analyzed, sorted and counted; creating a meaningful and engaging data visualization; and ultimately telling the story of what the data was trying to tell us. Along the way, our students learned how to use many software tools and data visualization programs to present their stories. Of course, the best of stories always end with more questions. So for our example, students used an Excel spreadsheet to build a pivot table to count the number of unique dog names, sorted the list for the top ten, and visualized the results in various charts, graphs, infographics and the like. Winner: “Bella”. But the elephant in the room: Why that name, why Bella? For how many years was it in the top ten? In what ZIP Code would we find the largest number of Bellas? How many Bellas were German Shepherds, and how many were Labradors? (It was obvious, more study was required to answer those questions, and down the rabbit hole we went…) A fun and entertaining project by all accounts, and the students had some fun with the data and reaching their conclusions. But if our metric is to measure this project’s impact on society or a student’s life, we rate it low. But what if the dataset instead dealt with accidental overdoses, or car crashes, or incidence of crime in our neighborhoods. What about air quality, obesity rates or census data? Are there stories to tell lurking in those datasets? Can we find the patterns and trends lurking in this data, and will we know what to do with it? What about data that students themselves generate from, say an air or water quality monitor, or a home radon kit? Can high school students use their talents and skills to obtain, analyze and visualize this data? Can students really discover trends? Can teenagers really make informed conclusions, decisions and advocate for change based on their analysis of these datasets? We believe so, and that is our goal as we hope to equip our students with the tools and techniques needed to explore the world of data and how it can be an agent of change for their lives and their community. *Lee Cristofano co-teaches an elective class for Data Analtitics with Emily Smoller at Bethel Park High School.* This is the latest in a series of blogs from the teacher cohort.
- By Sue Mellon As the year long cohort exploration into the concept of “fluency” was coming to an end last June, I needed to create a series of lessons. With ideas such as “student choice and voice,” “what does it mean to be an advocate,” and “tech and data fluency” spinning through my head, I stumbled upon a Common Sense Media activity that became my inspiration. The Common Sense Media activity directed that students should collect data about their own technology use and then select an area of their tech use to view metaphorically. The activity then proposed students write a haiku based on this metaphor. For extension, the lesson page suggested creating a video with the haiku. The extension hooked me. Over six years ago, when learning about Arts & Bots, I first heard my acquired mantra that “Students should be more than consumers of technology. Students should be creators with technology,” from Dr. Illah Nourbakhsh. The creation of a video offered my students a stimulating adventure as they turn their thoughts (student voice) into something observable. My lessons were designed for an 8th grade Music STEAM class that I coteach with my peer, Beth Minda. Beth is our choral teacher and drama director. Because of her many talents and expertise, I knew that the opportunity for creativity could be pushed one step further by having the students compose original music for their iMovies using GarageBand loops. The students amazed us with their finished products and we didn’t have to push. As an elective, we had the luxury of giving the students two or three days to explore and play with GarageBand before they had to compose 30 seconds of music. I wonder how teachers who teach ‘tested’ subjects would view these two or three days. As much as I underestimated the students’ joy of creativity, I over estimated their abilities with data. I predicted their data skills based on Excel activities and statistics lessons from 6th and 7th grade. For this unit, my plan added a requirement that to make two different charts of their data using either Google Sheets or Excel. We were scrambling to keep frustration at a minimum. When we repeat this unit, we plan to front load a few lessons about collecting and manipulating data. We viewed the videos as a class and all gave feedback. The students then went back and made changes to either their iMovie or their GarageBand music based on the feedback. Individually, students entered a reflection process and one area for reflection was to determine what their tech activity would have been like “old school.” They were asked to compare “old school” to now and see if “old school” had any advantages. At the end of this contemplation, they were to give “a piece of advice” using PosterMyWall.com to students their age. Again, we were astounded by their thoughts. While we could have re-entered a feedback loop and reflection process with the PosterMyWall submissions, we decide to move on. Middle school students just need change sometimes. The students do know that we took their ideas and created a survey. We are in the process of having students in other grades and other schools take the survey. At the end of the semester, we will share the results with them. We will all learn if students in other grades and schools view tech the same as they do. You are invited to view both the videos and the posters with the following link: https://docs.google.com/document/d/1zxaOze8FitW36vsPEcyFQLi-Cu4MoaMJ6Pf26BqDEfQ/edit I hope that you enjoy learning my students’ ideas as much as I did. This is the latest in a series of blogs from the teacher cohort.
- By Lindsey Lamm I did it. I had an entire timeline, ideas laid out from beginning to end, a goal toward which we wanted to work, and genuine excitement for this program implementation. School life got in the way. That’s the easiest way for me to say it. Though we still may not have a definition of fluency when asked, I do believe we have stumbled upon some amazing practices, ideas, and philosophical changes for the better in education. It hasn’t been easy, though. I thought this blog post could focus on the lessons I’ve learned from the kinks in the process, in hopes that others could feel encouraged should they choose to join us on this journey. 1.) The best-laid plans will still need to be adapted and changed. These changes could be due to the group of students with whom you are working. Some groups need more time than others to pick up routines. Changes could happen due to the nature of the school culture. Responsibilities need to be shared, changed, or eliminated, causing us to absolutely need flexibility at all times. Finally, plans could change because you hear a fabulous idea that, with a bit of work, could make all the difference in a positive way in your classroom. Remember implementation is a marathon, not a sprint. You may even feel like you are losing ground at times. Keep at it. It gets better, and the results for the kids are ALWAYS worth it. 2.) Kids will surprise you if you choose to truly listen to them. Knowing your kids and how to balance choice on their part, student voice, and the proper amount of guidance to minimize frustration is the hardest part of this process. It’s amazing how capable they are when they get over the hump of thinking differently, a skill fluency requires. 3.) Try implementing fluency practices INTO EXISTING CURRICULAR PROJECTS, not starting from scratch. Stop implementing technology for the sake of “doing technology”. You’ll drive yourself crazy as a teacher, as we don’t have the time for it, and the kids will not have the fully-encompassing experience necessary to truly grasp the concepts being taught. In the end, we want students to be competent in using a plethora of tools, applications, and software to allow them to dig deeper into the root of a problem to help find a plausible, researched solution about which they can get excited. 4.) Meet the kids where they are, not where you want them to be or where you think they are. When we start focusing on where they “should be” or where we “think they are,” projects and instruction becomes teacher-centered, not student-centered. We take away student voice when we are doing all the talking (because we think the kids should know something and they don’t) or when we are presenting situations that are at a level one depth of knowledge for our students. In order for fluency to happen, students need to grapple with an issue, not immediately take a side and be done in ten minutes. Students HAVE TO THINK when it comes to this process. Very rarely is there one solution path and one correct answer. 5.) You HAVE to be OK with allowing the students to guide the process – This process is a learning experience for everyone involved. The teacher cannot lead the process. Parameters can certainly be set. In fact, in the elementary classroom, they must be set, as students are still learning and getting away from the idea that the teacher always has the correct answer. Fluency is truly a culture and philosophy change, not a project. Every time I meet with these people, I have ideas that can be used. We learn from each other as we try to figure out this definition of Fluency. Those are the lessons I’ve learned so far. I can only hope the projects this year allow for even more growth for our classroom. |
Archives
October 2020
Categories |

This work is licensed under a Creative Commons Attribution-NonCommercial-ShareAlike 4.0 International License.
 RSS Feed